Llansadwrn (Anglesey) Weather:
Rainfall Autumn 2000

Llansadwrn (Anglesey) Weather: |

|
Rainfall in the autumn of 2000 has been exceptional in resulting in extensive flooding of homes, towns and the countryside of much of England, Wales and Scotland. It has brought to the attention of government, and all those people affected, the importance of climatic events on the infrastructure and lives of the citizens of the UK in a way that would have been otherwise difficult, if not impossible. While Anglesey has been minimally affected compared with areas wide spread as as Yorkshire, Sussex, Devon and Glamorgan, the rainfall has nevertheless been noteworthy. Rainfall has been measured at Llansadwrn since 1928. While there are longer records for Anglesey, and other parts, the 72 year record is both interesting and useful to compare with the rainfall of the autumn of the year 2000.
Observations of rainfall began in Llansadwrn in 1928 at Treffos 680 m southwest of my station. Treffos was a former palace of the Bishops of Bangor. In 1928 the then owner C. Panton Vivian Esq. made observations in the walled kitchen garden. Later on they were done by Head Gardener Dic O'Connor. When the house and garden fell into disuse Mr O'Connor continued the readings eventually moving the site a short distance to his garden at Treffos Lodge. In 1936 observations started to be also taken at Gadlys Cottage (part of the former Gadlys Country Estate), 360 m west of the present site, by Anwyl E. C. Morgan Esq. These continued until April 1974 and for a time the 2 records ran concurrently. The Treffos record continued until 1976. From 1977 to April 1978 Mr O'Connor made observations at a new site at Maen Hir, 2.0 km south-southwest of the present station. Before moving away from the area Mr O'Connor made his personal records available to me. I began observations at Gadlys Lodge in January 1979. Where 2 station records are available the average was taken when calculating the means, but individual observations are used when considering record falls. Rain measurements were made using a 5in diameter gauge; autographic records were from a natural siphon gauge run along side.
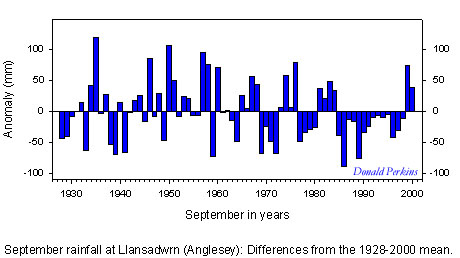
September 2000 was a wet month with 139mm, but it was only the 15th wettest in the records. The highest fall of 32.2mm was on the 19th but there were 2 other wet days with totals of 22.4mm on the 17th and 24.5mm on the 27th. Rain days (0.2mm or more) 19 and wet days (1.0mm or more) 17 were both 5 above average while days 5mm, or more, were 4 above average. Rainfall duration in the month was 86.8h; the longest duration fall was 11.2h on the 27th.
|
September with a long-term average (LTA) of 101mm is the fifth wettest month of the year. There have been 32 Septembers with 100mm, or more. The wettest September was in 1935 having 221mm of rain. Other notable wet Septembers were 1946 (186mm), 1950 (207mm), 1957 (195mm), 1958 (176mm), and 1976 (180mm). The wet 1976 September followed the hot dry summer that had a total of only 70mm. The years 1981-1984 had Septembers with totals of 120mm, or more. Since then there has been a marked absence of heavy September rains until 1999 that had 174mm. The years 1985-98 were all below the LTA. These 14 years represent an exceptional period of dry Septembers there being no other such period in the record. It includes the driest September on record, that had only 12mm rain, and in 1989 the second driest with 25mm. Other notable dry Septembers were 1933 (37mm), 1939 (31mm), 1941 (34mm), 1959 (27mm), 1969 (32mm) and 1972 (33mm).
October 2000 was a very wet month with 223mm, 207% of the 1961-90 climatological average. It was the fourth wettest October in the Llansadwrn records. There were some very wet days with the 29th having 35.8mm, the wettest October day since 36.6mm in 1991, and the 26th with 29.6mm. Six days exceeded 10mm and 16 days had more than 5mm. The number of wet days 23 (+7.7) and rain days 29 (+10.6), both were the most recorded at this site since records began in 1979. There was only 1 dry day, the 21st. Rainfall duration in the month was 137.8h; the longest duration fall was 16.0h on the 29th.
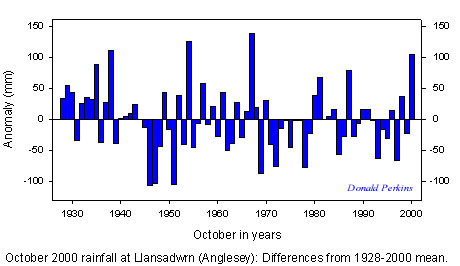 |
Only 3 Octobers exceed the October 2000 total. These were in 1967 (259mm the wettest), recorded at Gadlys Cottage, 1954 (249mm) at Treffos and in 1938 (230mm) at Treffos. Some other very wet Octobers were 1935 (208mm), 1981 (186mm) and 1987 (198mm). October with a LTA of 119mm is the second wettest month of the year. There have been 47 Octobers with 100mm, or more. The longest period of wet Octobers seems to be from 1928-35 but did include 2 years (1931 and 1936) with below average rainfall. The driest October was at Gadlys Cottage in 1946 (9mm) with the next year 1947 was also dry with 15mm recorded at Treffos. Other notable dry Octobers were 1951 (14mm), 1969 (33mm), 1972 (43mm) and 1978 (42mm). The longest period of years with below average rainfall was from 1944-1951, but included 1 above average.
The rains continued into November. With 250.5mm (203% of the 1961-90 climatological average) November 2000 was the wettest on record. It was also the second wettest of any month of the year. The wettest month with just a few millimetres more was October 1967, with 259mm, recorded at Treffos. There were some very wet days in November 2000 with the 5th having 30.4mm and the 13th with 25.2mm. Some rain fell every day in the month; there were no dry days possibly a record. In the record holding 1967 there were 2 dry days! The number of rain days 28 (+6.5); wet days 26 (+9.7); and days of 5mm, or more, 18 (+10.0) were all the most recorded at this site since records began in 1979. Rainfall duration in the month was 184.3h; the longest duration fall was 18.0h on the 5th.
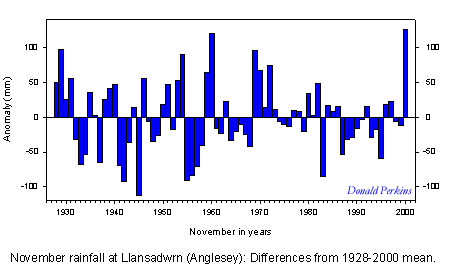 |
November with a LTA of 124mm is usually the wettest month of the year. In the 72 year record 50 Novembers had 100mm, or more. The 5 Novembers (including 2000) with 200mm, or more, are 1929 (221mm), 1954 (215mm), 1960 (244mm) and 1969 (220mm). Some very wet periods, that include 4 or 5 consecutive years with above average rainfall, were 1928-1931 and 1969-1972. The driest November was 1945 with 11mm. Other dry Novembers include 1942 (32mm), 1955 (34mm), and 1983 (39mm). The 17 year period 1983-99 had 11 years with below average November rainfall. Similarly the years 1955-68 had 12 out of the 14 years drier than average and 1941-49 had 7 years.
Autumn 2000 rainfall at Llansadwrn.
____________________________________________________________
                   Average        Number of days
                    mm   1961-90    Rain    Wet  5mm or more
____________________________________________________________

September       138.6   151%      19      17        10
October         223.0   207%      29      23        16
November        250.5   203%      28      26        18
____________________________________________________________

Autumn          612.1   187%      76      66        44
____________________________________________________________
|
Rainfall in autumn 2000 (September-November) totalled 612mm and was the largest on record. The wettest day was on 29th October having 35.8mm in the 24-h to 0900-0900 GMT. Other heavy falls were 32.2mm on 19th September, 24.5mm on 27th September, 29.6mm on 26th October, 30.4mm on 5th November, 24.4mm on 8th November and 25.2mm on 13th November. In all there were 44 days that had 5mm, or more. The number of wet days were 66 and rain days 76. One day recorded 0.1mm and there were 5 days with trace amounts. But there were 9 dry days, 8 in September and 1 in October. The duration of rainfall totalled 408.9h.
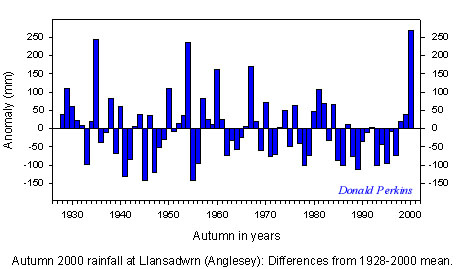 |
Autumn with a LTA of 344mm is the wettest season of the year with winter not far behind with 292mm. The driest season is spring with 197mm followed by summer with 238mm. Including autumn 2000 with 612mm there are 5 with rainfall totals of 500mm, or more: 1935 (589mm), 1954 (580mm), 1960 (507mm) and 1967 (515mm). Other notably wet autumns were 1929 (455mm), 1950 (454mm) and 1981 (451mm). Periods with at least 5 consecutive wetter than average autumns were 1928-34 (1 dry year) and 1957-61. The last wetter than average autumn period was 1980-84, but 1983 was drier. This was followed by 13 years, 1985-97 with almost all autumns drier than average. This period included the driest 2-year spell on record, from April 1995-March 1997, total rainfall was 1529mm. Also, the 12-months April 1995-March 1996 with 649mm were the driest on record (Perkins 1997). Another period with 4 consecutive dry autumns was 1962-1965. The driest autumn, however, was in 1943 that had only 201mm.
An examination of daily rainfall of 0.2mm, or more, showed more than half the autumn days (56 or 62%) had less than 10mm. Heavier falls of 10mm, or more, occurred on only 20 days or 22%. The remaining 15 days (13%) received less than 0.2mm that defines a 'rain day'. Most days (32 or 35%) had between 0.2mm and 5mm while 26% received between 5-10mm.
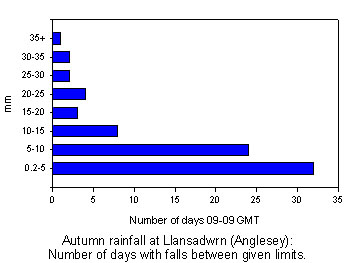 |
Of the heavier falls, 8 days received between 10-15mm, relatively few (12) had 15mm or more. Only 5 days received 25mm (almost an inch), or more. What has made autumn 2000 so wet was the consecutive daily occurrence of the rain. Although there was only 1 spell of 15, or more, rain days, the 21 between Nov 5-25, there have been several near misses. These were Oct 1-14 (14 days) and Oct 22-Nov 3 (13 days). There were no spells of 'wet days', 1.0mm or more, a near miss was Nov 13-24 (13 days). Other wet spells were Oct 26- 3 Nov (9 days), Oct 3-9 (7 days) and Nov 5-11 (7 days).
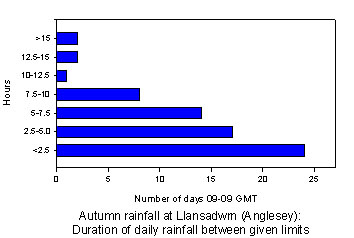
On most autumn rain days (55 or 72%) rain was falling for up to 7.5h. While 24, or 32%, of these had durations less than 2.5h, 17 or 22% had between 2.5-5.0h of rainfall. Another 14 days, or 18%, had between 5-7.5h rain. Falls of at least 5h occurred on 21 days. The longest duration falls (09-09 GMT) were on 5 November (18.0h), 29 October (16.0h) and 24 October (14.5h). There were 2 long falls that spanned either side of 0900 GMT. These were on 13/14 October (18.4h) accumulating 22.3mm and 5/6 November (24.1h) that accumulated 38.0mm. The latter fall was the longest continuous rainfall, and the largest amount accumulated, of the autumn.
 |
 |
The autumn rainfall at Llansadwrn has come about by the heavy falls experienced in October and November. September rainfall, while being above average, was only the 15th largest in the records back to 1928. October rainfall, however, was the fourth wettest and well above average. Combined with the wettest November on record this has made it the wettest autumn on record. The numbers of rain days, wet days and heavier falls (5mm or more) have increased over the last 21 years. If September's rainfall had been larger, say perhaps just in excess of the present record of 221mm in 1935, then the autumn total could have had another 90mm bringing the total to about 700mm. This would have been exceptionally in excess of the previous record. If the dry Septembers of the years 1985-98 are over for a while, and then it is possible that more wet autumns will occur, as both October and November are on average the wettest months. Two of the other wet autumns in the past 72 years (1935, 1954) came about by having wet Septembers. The probability of the circumstances reoccurring is not insignificant. This is nothing to do with global warming. What a change in climate would do is to either make the probability greater or less. Climate prediction models suggest that, particularly in the west, the weather would be wetter and the chance of wet autumns could increase. If we have a long succession of wet autumns, or an increased frequency, then it could be said that the climate has indeed changed.
It is not unusual to have a lot of rain in Britain but like snow we always seem to be unprepared for it. It seems to me that our roads need better drainage, the ditches are too small to carry away surface water on to the surrounding fields. On country roads the absence of the 'road man' of past years has brought about a deterioration. Working on his own section of road he kept the hedges trimmed and the ditches open. He knew where the drain holes were in walls and banks. He has gone and been replaced with mechanical hedge cutters that can fill the ditches with debris. Damage to banks and walls go unrepaired. Knowledge of the drainage holes has been lost; as a result many roads are often covered with surface water!
Rivers are natural systems that carry the water from the uplands of Wales to the sea. Over the years riverbanks and flood plains have become desirable places to build houses, shops and factories. Drainage has been improved in many places resulting in more water being put quickly into river systems. It is a characteristic of flood plains to flood from time to time and this natural process has been curtailed by flood prevention schemes. It has been realised now that it will be necessary to allow the flooding of areas and to recreate water meadows. Much more careful planning of building developments needs to be done. This type of approach will certainly be necessary if the frequency of wet autumns (and winters) increases.
I was pleased to have the assistance of Mr Ivor McLean, former Senior Meteorological Officer at RAF Valley and the Librarian of the Meteorological Office, Bracknell for filling in some missing records.
Meteorological Office. Vs. to 1968. British Rainfall, Part 1. HMSO
Meteorological Office. 1969-90. Monthly and Annual Totals of Rainfall for the United Kingdom. Bracknell HMSO
Meteorological Office 1970-91. Monthly Weather Report: Annual Summaries. HMSO.
Perkins D. F. (1997). Two years of record low rainfall. Bulletin Climatological Observers Link (ed. Terry Mayes), No. 323 p51.
Return to top of page
Document dated: 12 December 2000. This page is maintained at http://www.llansadwrn-wx.co.uk
Copyright ©: 2000 Donald Perkins